
Page 30 - Turkinsurance Digital Magazine
P. 30
30 country profile
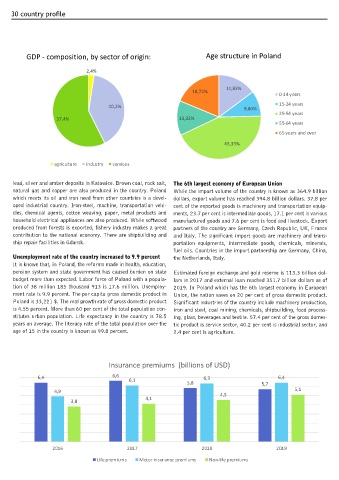
GDP - composition, by sector of origin: Age structure in Poland
2,4%
14,83%
18,72%
0-14 years
40,2% 9,80% 15-24 years
25-54 years
57,4% 13,32%
55-64 years
65 years and over
43,33%
agriculture industry services
lead, silver and amber deposits in Katowice. Brown coal, rock salt, The 6th largest economy of European Union
natural gas and copper are also produced in the country. Poland While the import volume of the country is known as 364.9 billion
which meets its oil and iron need from other countries is a devel- dollars, export volume has reached 394.8 billion dollars. 37.8 per
oped industrial country. Iron-steel, machine, transportation vehi- cent of the exported goods is machinery and transportation equip-
cles, chemical agents, cotton weaving, paper, metal products and ments, 23.7 per cent is intermediate goods, 17.1 per cent is various
household electrical appliances are also produced. While softwood manufactured goods and 7.6 per cent is food and livestock. Export
produced from forests is exported, fishery industry makes a great partners of the country are Germany, Czech Republic, UK, France
contribution to the national economy. There are shipbuilding and and Italy. The significant import goods are machinery and trans-
ship repair facilities in Gdansk. portation equipments, intermediate goods, chemicals, minerals,
fuel oils. Countries in the import partnership are Germany, China,
Unemployment rate of the country increased to 9.9 percent the Netherlands, Italy.
It is known that, in Poland, the reforms made in health, education,
pension system and state government has caused burden on state Estimated foreign exchange and gold reserve is 113.3 billion dol-
budget more than expected. Labor force of Poland with a popula- lars in 2017 and external loan reached 351.7 billion dollars as of
tion of 38 million 185 thousand 913 is 17.6 million. Unemploy- 2019. In Poland which has the 6th largest economy in European
ment rate is 9.9 percent. The per capita gross domestic product in Union, the nation saves on 20 per cent of gross domestic product.
Poland is 33,221 $. The real growth rate of gross domestic product Significant industries of the country include machinery production,
is 4.55 percent. More than 60 per cent of the total population con- iron and steel, coal mining, chemicals, shipbuilding, food process-
stitutes urban population. Life expectancy in the country is 78.5 ing, glass, beverages and textile. 57.4 per cent of the gross domes-
years on average. The literacy rate of the total population over the tic product is service sector, 40.2 per cent is industrial sector, and
age of 15 in the country is known as 99.8 percent. 2.4 per cent is agriculture.
Insurance premiums (billions of USD)
6,4 6,6 6,3 6,4
6,1
5,8 5,7
4,9 4,5 5,1
4,1
3,8
2016 2017 2018 2019
Life premiums Motor insurance premiums Non-life premiums