
Page 25 - Turkinsurance Digital Magazine
P. 25
25
Technical profit and loss figures in the traffic and motor own-damage branches
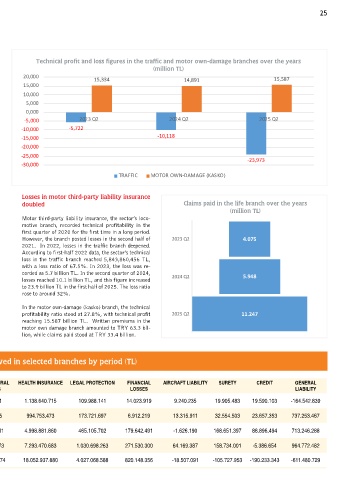
Technical profit and loss figures in the traffic and motor own-damage branches over the years
over the years (million TL)
(million TL)
20,000 15,334 14,891 15,587
15,000
10,000
5,000
0,000
-5,000 2023 Q2 2024 Q2 2025 Q2
-10,000 -5,722
-15,000 -10,118
-20,000
-25,000 -23,973
-30,000
TRAFFIC MOTOR OWN-DAMAGE (KASKO)
Losses in motor third-party liability insurance
Claims paid in the life branch over the years
doubled Yıllar itibariyle hayat branşında ödenen
(million TL)
hasarlar (milyon TL)
Motor third-party liability insurance, the sector’s loco-
motive branch, recorded technical profitability in the
first quarter of 2020 for the first time in a long period.
However, the branch posted losses in the second half of 2023 Q2 4.075
2021. In 2022, losses in the traffic branch deepened.
According to first-half 2022 data, the sector’s technical
loss in the traffic branch reached 5,843,860,456 TL,
with a loss ratio of 67.5%. In 2023, the loss was re-
corded as 5.7 billion TL. In the second quarter of 2024, 2024 Q2 5.948
losses reached 10.1 billion TL, and this figure increased
to 23.9 billion TL in the first half of 2025. The loss ratio
rose to around 32%.
In the motor own-damage (kasko) branch, the technical
profitability ratio stood at 27.8%, with technical profit 2025 Q2 11.247
reaching 15.587 billion TL. Written premiums in the
motor own damage branch amounted to TRY 63.3 bil-
lion, while claims paid stood at TRY 33.4 billion.
Technical profit and loss figures observed in selected branches by period (TL)
ACCIDENT MOTOR VEHICLES GENERAL DAMAGES MOTOR THIRD-PARTY TRANSPORTATION FIRE AND NATURAL HEALTH INSURANCE LEGAL PROTECTION FINANCIAL AIRCRAFT LIABILITY SURETY CREDIT GENERAL
LIABILITY DISASTERS LOSSES LIABILITY
2021 Q2 657.571.643 1.157.763.141 572.172.114 -290.970.678 239.695.484 669.601.621 1.138.640.715 109.988.141 14.023.919 9.240.235 19.905.483 19.590.103 -164.542.839
2022 Q2 917.374.256 502.965.055 639.985.480 -5.461.350.727 504.015.003 942.809.905 994.753.473 173.721.697 6.912.219 13.315.911 32.554.503 23.657.353 737.253.467
2023 Q2 2.123.258.060 15.334.916.3 15 2.246.792.955 -4.903.620.604 626.902.554 1.009.709.311 4.998.881.860 465.105.702 179.642.491 -1.626.190 168.651.397 88.896.494 713.246.288
2024 Q2 4.760.760.543 14.891.473.840 4.826.599.209 -7.009.094.168 1.552.424.011 8.792.250.673 7.293.470.683 1.030.698.263 271.530.300 64.169.387 158.734.001 -5.386.654 964.772.482
2025 Q2 7.128.820.042 15.587.596.516 5.301.626.978 -2.908.018.481 1.839.031.671 15.149.069.674 18.052.937.880 4.027.068.588 820.148.356 -18.507.091 -105.727.953 -190.233.343 -611.480.729