
Page 24 - Turkinsurance Digital Magazine
P. 24
24 insurance outlook
Technical profit and profit/loss ratios in the life branch over the years
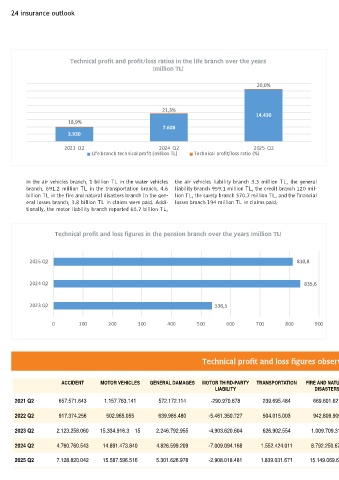
Technical profit and profit/loss ratios in the life branch over the years (million TL)
(million TL)
20,0%
21,3%
14.430
18,9%
7.608
3.930
2023 Q2 2024 Q2 2025 Q2
Life branch technical profit (million TL) Technical profit/loss ratio (%)
in the air vehicles branch, 1 billion TL in the water vehicles the air vehicles liability branch 3.3 million TL, the general
branch, 691.2 million TL in the transportation branch, 4.6 liability branch 959.1 million TL, the credit branch 120 mil-
billion TL in the fire and natural disasters branch In the gen- lion TL, the surety branch 370.7 million TL, and the financial
eral losses branch, 3.8 billion TL in claims were paid. Addi- losses branch 194 million TL in claims paid.
tionally, the motor liability branch reported 65.7 billion TL,
Technical profit and loss figures in the pension branch over the years (million TL)
Technical profit and loss figures in the pension branch over the years (million TL)
2025 Q2 810,8
2024 Q2 835,6
2023 Q2 536,5
0 100 200 300 400 500 600 700 800 900
Technical profit and loss figures observed in selected branches by period (TL)
ACCIDENT MOTOR VEHICLES GENERAL DAMAGES MOTOR THIRD-PARTY TRANSPORTATION FIRE AND NATURAL HEALTH INSURANCE LEGAL PROTECTION FINANCIAL AIRCRAFT LIABILITY SURETY CREDIT GENERAL
LIABILITY DISASTERS LOSSES LIABILITY
2021 Q2 657.571.643 1.157.763.141 572.172.114 -290.970.678 239.695.484 669.601.621 1.138.640.715 109.988.141 14.023.919 9.240.235 19.905.483 19.590.103 -164.542.839
2022 Q2 917.374.256 502.965.055 639.985.480 -5.461.350.727 504.015.003 942.809.905 994.753.473 173.721.697 6.912.219 13.315.911 32.554.503 23.657.353 737.253.467
2023 Q2 2.123.258.060 15.334.916.3 15 2.246.792.955 -4.903.620.604 626.902.554 1.009.709.311 4.998.881.860 465.105.702 179.642.491 -1.626.190 168.651.397 88.896.494 713.246.288
2024 Q2 4.760.760.543 14.891.473.840 4.826.599.209 -7.009.094.168 1.552.424.011 8.792.250.673 7.293.470.683 1.030.698.263 271.530.300 64.169.387 158.734.001 -5.386.654 964.772.482
2025 Q2 7.128.820.042 15.587.596.516 5.301.626.978 -2.908.018.481 1.839.031.671 15.149.069.674 18.052.937.880 4.027.068.588 820.148.356 -18.507.091 -105.727.953 -190.233.343 -611.480.729