
Page 21 - Turkinsurance Digital Magazine
P. 21
21
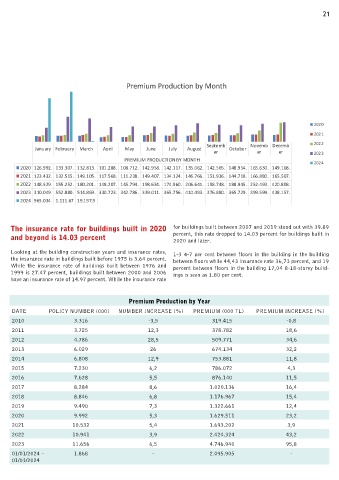
Premium Production by Month
2020
2021
Septemb Novemb Decemb 2022
January February March April May June July August October
er er er 2023
PREMIUM PRODUCTION BY MONTH 2024
2020 126.992. 133.307. 132.813. 101.288. 108.712. 142.958. 142.117. 135.062. 142.565. 148.954. 165.630. 149.108.
2021 123.432. 132.515. 149.105. 117.568. 111.238. 149.407. 134.124. 146.766. 151.936. 144.718. 166.880. 165.507.
2022 148.529. 155.252. 180.201. 148.207. 145.794. 198.634. 174.960. 206.641. 198.748. 188.945. 252.493. 420.808.
2023 310.049. 552.880. 514.869. 330.723. 342.786. 339.011. 365.756. 410.493. 376.880. 365.729. 399.599. 438.157.
2024 965.034. 1.111.67 19.197.9
The insurance rate for buildings built in 2020 for buildings built between 2007 and 2019 stood out with 39.89
and beyond is 14.03 percent percent, this rate dropped to 14.03 percent for buildings built in
2020 and later.
Looking at the building construction years and insurance rates, 1-3 4-7 per cent between floors in the building in the building
the insurance rate in buildings built before 1975 is 3.64 percent. between floors while 44,43 insurance rate 36,73 percent, and 19
While the insurance rate of buildings built between 1976 and percent between floors in the building 17,04 8-18-storey build-
1999 is 27.47 percent, buildings built between 2000 and 2006 ings is seen as 1.80 per cent.
have an insurance rate of 14.97 percent. While the insurance rate
Premium Production by Year
DATE POLICY NUMBER (000) NUMBER INCREASE (%) PREMIUM (000 TL) PREMIUM INCREASE (%)
2010 3.316 -3,5 319.415 -0,8
2011 3.725 12,3 378.782 18,6
2012 4.786 28,5 509.771 34,6
2013 6.029 26 674.134 32,2
2014 6.808 12,9 753.881 11,8
2015 7.230 6,2 786.072 4,3
2016 7.628 5,5 876.140 11,5
2017 8.284 8,6 1.020.136 16,4
2018 8.846 6,8 1.176.967 15,4
2019 9.490 7,3 1.322.661 12,4
2020 9.992 5,3 1.629.511 23,2
2021 10.532 5,4 1.693.202 3,9
2022 10.941 3,9 2.424.324 43,2
2023 11.656 6,5 4.746.940 95,8
01/01/2024 - 1.868 - 2.095.905 -
01/03/2024