
Page 19 - Turkinsurance Digital Magazine
P. 19
19
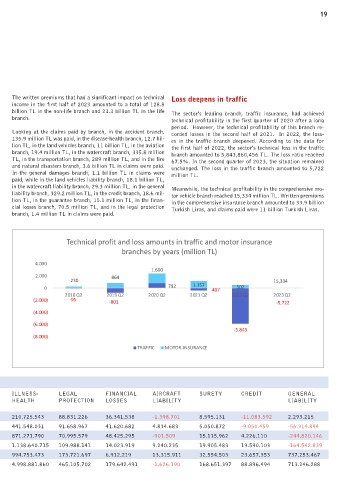
The written premiums that had a significant impact on technical Loss deepens in traffic
income in the first half of 2023 amounted to a total of 128.8
billion TL in the non-life branch and 23.3 billion TL in the life The sector's leading branch, traffic insurance, had achieved
branch. technical profitability in the first quarter of 2020 after a long
period. However, the technical profitability of this branch re-
Looking at the claims paid by branch, in the accident branch, corded losses in the second half of 2021. In 2022, the loss-
135.9 million TL was paid, in the disease-health branch, 12.7 bil- es in the traffic branch deepened. According to the data for
lion TL, in the land vehicles branch, 11 billion TL, in the aviation the first half of 2022, the sector's technical loss in the traffic
branch, 19.4 million TL, in the watercraft branch, 335.8 million branch amounted to 5,843,860,456 TL. The loss ratio reached
TL, in the transportation branch, 289 million TL, and in the fire 67.5%. In the second quarter of 2023, the situation remained
and natural disasters branch, 3.6 billion TL in claims were paid. unchanged. The loss in the traffic branch amounted to 5,722
In the general damages branch, 1.1 billion TL in claims were million TL.
paid, while in the land vehicles liability branch, 18.1 billion TL,
in the watercraft liability branch, 29.3 million TL, in the general Meanwhile, the technical profitability in the comprehensive mo-
liability branch, 329.2 million TL, in the credit branch, 18.6 mil- tor vehicle branch reached 15,334 million TL. Written premiums
lion TL, in the guarantee branch, 15.1 million TL, in the finan- in the comprehensive insurance branch amounted to 33.9 billion
cial losses branch, 70.5 million TL, and in the legal protection Turkish Liras, and claims paid were 11 billion Turkish Liras.
branch, 1.4 million TL in claims were paid.
Technical profit and loss amounts in traffic and motor insurance
branches by years (million TL)
4.000
1.600
2.000 864
230 15,334
0 792 1.157 -407 502
2018 Q2 2019 Q2 2020 Q2 2021 Q2 2022 Q2 2023 Q2
(2.000) -95 -801 -5,722
(4.000)
(6.000)
-5.843
(8.000)
TRAFFIC MOTOR-INSURANCE
Technical profit and loss amounts in selected branches over the periods (in TL)
ACCIDENT MOTOR GENERAL MOTOR TRANSPORTA- FIRE AND ILLNESS- LEGAL FINANCIAL AIRCRAFT SURETY CREDIT GENERAL
VEHICLES LOSSES VEHICLE TION NATURAL HEALTH PROTECTION LOSSES LIABILITY LIABILITY
LIABILITY DISASTERS
2018 Q2 442.820.755 230.124.184 168.514.821 66.091.981 143.669.038 361.249.700 210.725.543 88.831.226 36.341.538 -1.398.701 8.595.131 -11.083.592 2.293.215
2019 Q2 575.855.817 864.309.614 338.737.002 - 739.206.279 182.228.335 354.610.541 441.548.031 91.658.967 41.620.682 4.834.683 5.050.872 -9.050.459 -56.314.894
2020 Q2 645.250.473 1.600.568.823 276.508.525 882.668.028 156.682.376 441.849.687 871.271.790 70.995.579 48.425.295 -901.509 15.115.962 4.226.110 -244.820.146
2021 Q2 657.571.643 1.157.763.141 572.172.114 -290.970.678 239.695.484 669.601.621 1.138.640.715 109.988.141 14.023.919 9.240.235 19.905.483 19.590.103 -164.542.839
2022 Q2 917.374.256 502.965.055 639.985.480 -5.461.350.727 504.015.003 942.809.905 994.753.473 173.721.697 6.912.219 13.315.911 32.554.503 23.657.353 737.253.467
2023 Q2 2.123.258.060 15.334.916.315 2.246.792.955 -4.903.620.604 626.902.554 1.009.709.311 4.998.881.860 465.105.702 179.642.491 -1.626.190 168.651.397 88.896.494 713.246.288