
Page 18 - Turkinsurance Digital Magazine
P. 18
18
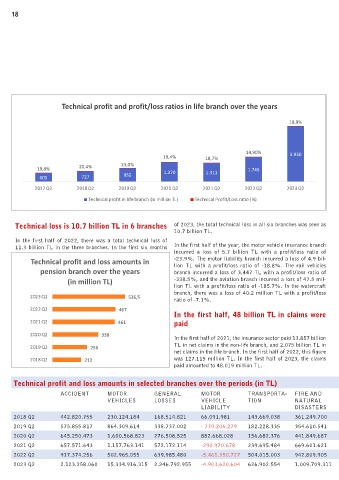
Technical profit and profit/loss ratios in life branch over the years
18,9%
14,90% 3.930
19,4% 18,7%
19,8% 20,4% 23,0% 1.370 1.311 1.746
605 727 955
2017 Q2 2018 Q2 2019 Q2 2020 Q2 2021 Q2 2022 Q2 2023 Q2
Technical profit in life branch (in million TL) Technical Profit/Loss ratio (%)
Technical loss is 10.7 billion TL in 6 branches of 2023, the total technical loss in all six branches was seen as
10.7 billion TL.
In the first half of 2022, there was a total technical loss of
11.3 billion TL in the three branches. In the first six months In the first half of the year, the motor vehicle insurance branch
incurred a loss of 5.7 billion TL with a profit/loss ratio of
Technical profit and loss amounts in -23.9%. The motor liability branch incurred a loss of 4.9 bil-
lion TL with a profit/loss ratio of -18.8%. The rail vehicles
pension branch over the years branch incurred a loss of 3.447 TL with a profit/loss ratio of
(in million TL) -338.5%, and the aviation branch incurred a loss of 47.5 mil-
lion TL with a profit/loss ratio of -185.7%. In the watercraft
branch, there was a loss of 40.2 million TL with a profit/loss
2023 Q2 536,5
ratio of -7.1%.
2022 Q2 467
In the first half, 48 billion TL in claims were
2021 Q2 461 paid
2020 Q2 338
In the first half of 2021, the insurance sector paid 13.857 billion
2019 Q2 256 TL in net claims in the non-life branch, and 2.075 billion TL in
net claims in the life branch. In the first half of 2022, this figure
2018 Q2 212 was 127.115 million TL. In the first half of 2023, the claims
paid amounted to 48.019 million TL.
Technical profit and loss amounts in selected branches over the periods (in TL)
ACCIDENT MOTOR GENERAL MOTOR TRANSPORTA- FIRE AND ILLNESS- LEGAL FINANCIAL AIRCRAFT SURETY CREDIT GENERAL
VEHICLES LOSSES VEHICLE TION NATURAL HEALTH PROTECTION LOSSES LIABILITY LIABILITY
LIABILITY DISASTERS
2018 Q2 442.820.755 230.124.184 168.514.821 66.091.981 143.669.038 361.249.700 210.725.543 88.831.226 36.341.538 -1.398.701 8.595.131 -11.083.592 2.293.215
2019 Q2 575.855.817 864.309.614 338.737.002 - 739.206.279 182.228.335 354.610.541 441.548.031 91.658.967 41.620.682 4.834.683 5.050.872 -9.050.459 -56.314.894
2020 Q2 645.250.473 1.600.568.823 276.508.525 882.668.028 156.682.376 441.849.687 871.271.790 70.995.579 48.425.295 -901.509 15.115.962 4.226.110 -244.820.146
2021 Q2 657.571.643 1.157.763.141 572.172.114 -290.970.678 239.695.484 669.601.621 1.138.640.715 109.988.141 14.023.919 9.240.235 19.905.483 19.590.103 -164.542.839
2022 Q2 917.374.256 502.965.055 639.985.480 -5.461.350.727 504.015.003 942.809.905 994.753.473 173.721.697 6.912.219 13.315.911 32.554.503 23.657.353 737.253.467
2023 Q2 2.123.258.060 15.334.916.315 2.246.792.955 -4.903.620.604 626.902.554 1.009.709.311 4.998.881.860 465.105.702 179.642.491 -1.626.190 168.651.397 88.896.494 713.246.288