
Page 23 - Turkinsurance Digital Magazine
P. 23
23
Technical profit and loss amounts in traffic and motor insurance branches by years (million TL)
TRAFFIC MOTOR INSURANCE
2018 Q1 (85) 162
2019 Q1 (378) 320
2020 Q1 65 683
2021 Q1 -260 655,7
2022 Q1 -2,936 -1,256
impact on technical income in the first quarter of 2021, reached a time. However, in the first quarter of 2021, this situation could not
total of TL 23 billion 456 million in the non-life branch and TL 5 be sustained and a loss was observed in traffic. In the first quar-
billion 536 million in the life branch. When we look at the damages ter of 2022, this loss deepened even more. In the first quarter of
paid on the basis of branches, we see that 39.1 million TL in the 2021, a technical loss of 260.4 million TL was seen in the traffic
accident branch, 2.7 billion TL in the sickness-health branch, 3.8 branch. This year, this loss increased to 2.9 billion TL. The damage
billion TL in the land vehicles branch, 7.6 million TL in the water in traffic reached 85%. Technical loss was also recorded in the
vehicles, 59.6 million TL in the transportation branch, 665 in the motor insurance branch. Recording a loss rate of 41.3% in motor
fire and natural disasters branch, 5 million TL damage was paid. insurance, the total technical loss in this branch was 1 billion 256
While a loss payment of 421.6 million TL was made in the general million TL. Premiums written off in the motor insurance branch
losses branch, 4.8 billion TL in the land vehicles liability branch, were seen as TL 5.8 billion and damages paid were seen as TL 3.8
7.6 million TL in the watercraft liability branch, 114.5 million TL billion. In the first quarter of 2021, the profitability in the motor
in the general liability branch, Claim payments of 8.1 million TL insurance branch was seen as 655 million 783 thousand TL.
in the credit branch, 60.5 million TL in the surety branch, 30.8
million TL in the financial losses branch. While technical profitability was 523 million 566 thousand TL in
state-supported agricultural insurances, 258.8 million TL was re-
Loss deepens in traffic branch corded in engineering insurances. The written premiums in agri-
cultural insurance exceeded 628.7 million TL. When we look at
Traffic insurance, the locomotive branch of the sector, showed engineering insurance, it is seen that the premiums written have
technical profit for the first time in 2020 after a long period of reached 790.6 million TL.
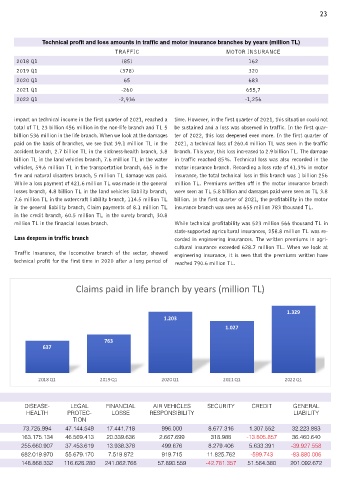
Claims paid in life branch by years (million TL)
1.329
1.203
1.027
763
637
2018 Q1 2019 Q1 2020 Q1 2021 Q1 2022 Q1
Technical profit and loss amounts arising in selected branches as of the periods (TL)
ACCIDENT LAND GENERAL LAND VEHICLES TRANSPOR- FIRE AND NATURAL DISEASE- LEGAL FINANCIAL AIR VEHICLES SECURITY CREDIT GENERAL
VEHICLES DAMAGES RESPONSIBILITY TATION DISASTERS HEALTH PROTEC- LOSSE RESPONSIBILITY LIABILITY
TION
2018 1.Ç 221.940.191 162.934.045 98.505.483 -4.706.735 61.806.563 213.623.573 73.725.994 47.144.549 17.441.718 996.000 8.677.316 1.307.552 32.223.883
2019 1.Ç 288.832.502 320.068.071 181.110.091 -372.093.695 81.723.719 144.642.957 163.175.134 46.569.413 20.339.636 2.667.699 318.988 -13.805.857 36.460.640
2020 1.Ç 345.127.592 683.017.088 147.843.851 124.109.203 89.242.536 275.382.192 255.660.907 37.453.619 13.938.378 499.676 8.279.406 5.633.391 -39.927.558
2021 1.Ç 331.937.789 655.783.157 203.280.140 -207.619.543 110.586.110 202.400.814 682.019.970 55.679.170 7.519.872 919.715 11.825.762 -599.743 -83.880.006
2022 1.Ç 546.539.722 -1.256.159.467 315.301.095 -2.714.951.826 231.118.697 407.835.487 148.868.332 116.628.280 241.062.768 57.890.559 -42.781.357 51.564.380 201.092.672