Page 22 - Turkinsurance Digital Magazine
P. 22

22
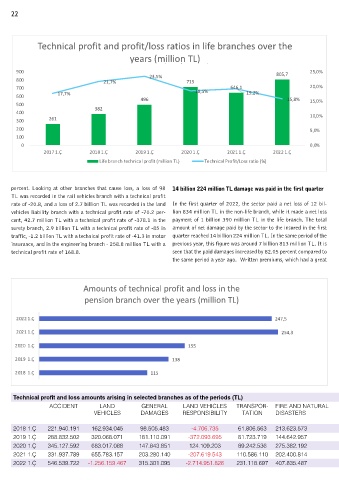
                  Technical profit and profit/loss ratios in life branches over the
                                                  years (million TL)
                      Yıllar itibarıyla hayat branşında teknik kar ve kar/zarar al profit and profit/loss ratios in life branches over the
              Technic
   900                                                                                                   805,7        25,0%
                                               years (million TL)
                                                       23,5%
   800                               21,7%    oranları (milyon TL)
                                                                      715
 900  700  900     17,7%                             23,5%               18,5%         646,1   19,2%  805,7   25,0% 25,0% 20,0%
                                                                                                     805,7
 800  600  800                   21,7% 21,7%       23,5%           715                                       15,8%
       700                                          496           715             646,1                       20,0%   15,0%
                                                                      18,5%
 700  500  600       17,7%        382                                18,5%         646,1  19,2%                   20,0%
                                                                                         19,2%
 600  400  500  17,7%                             496                                                 15,8%   15,0%   10,0%
                                                                                                         15,8%
 500  300  400  261  261          382           496                                                           10,0% 15,0%
 400  200  300                382                                                                                     5,0%
       200                                                                                                    5,0%  10,0%
 300  100  100  261
 200  0  0                                                                                                    0,0%  5,0%  0,0%
                                                  2019 Q1
              2017 Q1           2018 Q1          2019 1.Ç        2020 1.Ç        2021 1.Ç        2022 1.Ç  2022 Q1
                                                                    2020 Q1
                                                                                      2021 Q1
                                2018 1.Ç
                2017 1.Ç
 100
                                    Life branch technical profit (million TL)  Teknik Kar/Zarar oranı (%)
                                                                         Technical Profit/Loss ratio (%)
                                     Hayat branşı teknik kar (milyon TL)
  0                                                                                                               0,0%
          2017 Q1           2018 Q1           2019 Q1           2020 Q1           2021 Q1           2022 Q1
                                Life branch technical profit (million TL)  Technical Profit/Loss ratio (%)
     percent. Looking at other branches that cause loss, a loss of 98  14 billion 224 million TL damage was paid in the first quarter
     TL was recorded in the rail vehicles branch with a technical profit
     rate of -20.8, and a loss of 2.7 billion TL was recorded in the land  In the first quarter of 2022, the sector paid a net loss of 12 bil-
     vehicles liability branch with a technical profit rate of -70.2 per-  lion 834 million TL in the non-life branch, while it made a net loss
     cent, 42.7 million TL with a technical profit rate of -378.1 in the  payment of 1 billion 390 million TL in the life branch. The total
     surety branch, 2.9 billion TL with a technical profit rate of -85 in  amount of net damage paid by the sector to the insured in the first
     traffic, -1.2 billion TL with a technical profit rate of -41.3 in motor  quarter reached 14 billion 224 million TL. In the same period of the
     insurance, and in the engineering branch - 258.8 million TL with a  previous year, this figure was around 7 billion 813 million TL. It is
     technical profit rate of 168.8.                          seen that the paid damages increased by 82.05 percent compared to
                                                              the same period a year ago.  Written premiums, which had a great


                     Yıllar itibarıyla emeklilik branşında teknik kar ve zarar tutarları
                              Amounts of technical profit and loss in the
                                                     (milyon TL)
                               pension branch over the years (million TL)


       2022 1.Ç   2022 Q1                                                           247,5         247,5

       2021 1.Ç                                                                                     254,3
                  2021 Q1                                                             254,3
      2020  1.Ç                                                    155
                  2020 Q1                                      155
      2019  1.Ç                                              138
                  2019 Q1                                  138
      2018  1.Ç                                       115
                  2018 Q1                             115

                         0          50         100         150         200        250         300
      Technical profit and loss amounts arising in selected branches as of the periods (TL)
                  ACCIDENT          LAND           GENERAL       LAND VEHICLES      TRANSPOR-     FIRE AND NATURAL               DISEASE-        LEGAL       FINANCIAL        AIR VEHICLES       SECURITY       CREDIT         GENERAL
                                  VEHICLES        DAMAGES        RESPONSIBILITY       TATION      DISASTERS                      HEALTH         PROTEC-        LOSSE         RESPONSIBILITY                                    LIABILITY
                                                                                                                                                  TION
      2018 1.Ç    221.940.191    162.934.045      98.505.483        -4.706.735       61.806.563   213.623.573                   73.725.994     47.144.549    17.441.718          996.000         8.677.316      1.307.552      32.223.883
      2019 1.Ç    288.832.502    320.068.071      181.110.091      -372.093.695      81.723.719   144.642.957                   163.175.134    46.569.413    20.339.636         2.667.699         318.988      -13.805.857     36.460.640
      2020 1.Ç    345.127.592    683.017.088      147.843.851      124.109.203       89.242.536   275.382.192                   255.660.907    37.453.619    13.938.378          499.676         8.279.406      5.633.391     -39.927.558
      2021 1.Ç    331.937.789    655.783.157      203.280.140      -207.619.543     110.586.110  202.400.814                    682.019.970    55.679.170     7.519.872          919.715         11.825.762     -599.743      -83.880.006
      2022 1.Ç    546.539.722   -1.256.159.467    315.301.095     -2.714.951.826    231.118.697  407.835.487                    148.868.332   116.628.280    241.062.768       57.890.559       -42.781.357    51.564.380     201.092.672
   17   18   19   20   21   22   23   24   25   26   27